My Travel App
After traveling around the world for 9 months with a computer programmer, I decided to become one.
We lived together in Austin, Texas for 5 years, struggling to be musicians in the evenings and weekends while working day jobs. I was working as a freelance architect, carpenter, and installation artist for awhile until I found myself as a project manager in a commercial construction company. after 18 months of that, I decided it was time to fly the coup, see the world. my roommate agreed. we sold our furniture, filled our backpacks, and bought one-way tickets to Norway. 6 months quickly turned into 9 when we got stuck in India and Vietnam (by choice I might add).
While traveling, I kept track of our adventures on the Polarsteps app and logged all my expenses in a google spreadsheet. I eventually returned home, armed with lots of data, and got to work, creating my personal travel app.
I had learned html and CSS years back, building a WordPress website for artists in Austin, and I learned enough JavaScript and php to get the thing working. this time around I decided it was time to learn to program properly, start from scratch: computer science 101. i taught myself fundamentals, then JavaScript, and eventually found D3.js and fell in love. as a visual person who likes science and numbers, data visualization was calling my name.
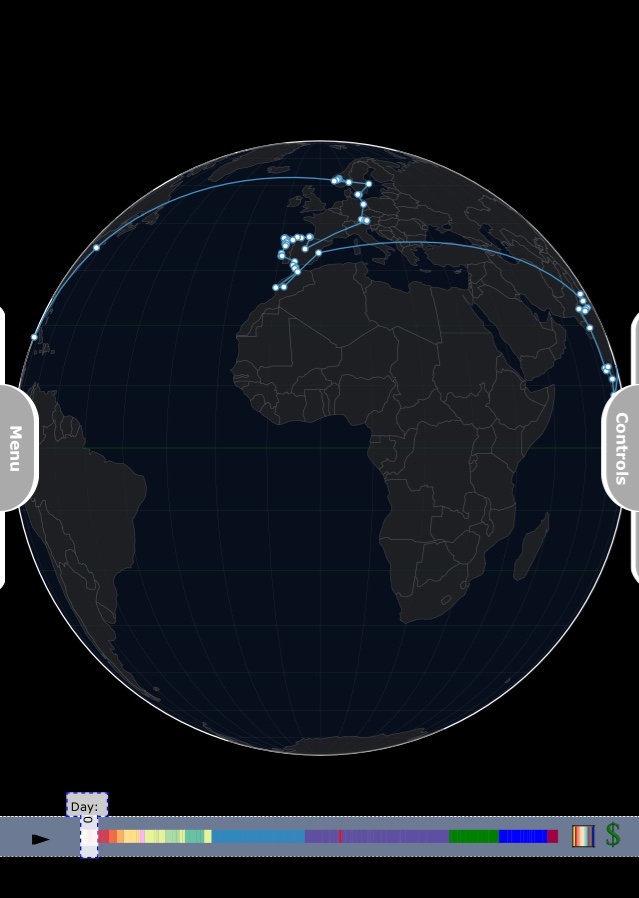
D3 was the base for my map with its complex map projections and DOM manipulation. I then created a fairly extensive UI to change light modes, map projection, toggle multiple trips, fullscreen/zoom, and add animation of the map based on the day. I converted my budget spreadsheet to json and made an interactive info-graphic, sort-able by daily average, total expenses, length of stay and chronologically. Node.js runs the backend with a RESTful API integrated into an html form for submission and photo upload to add "pins" to the map, sending the Data off to MongoDB mLab and Cloudinary. the app itself is deployed to heroku and on github.