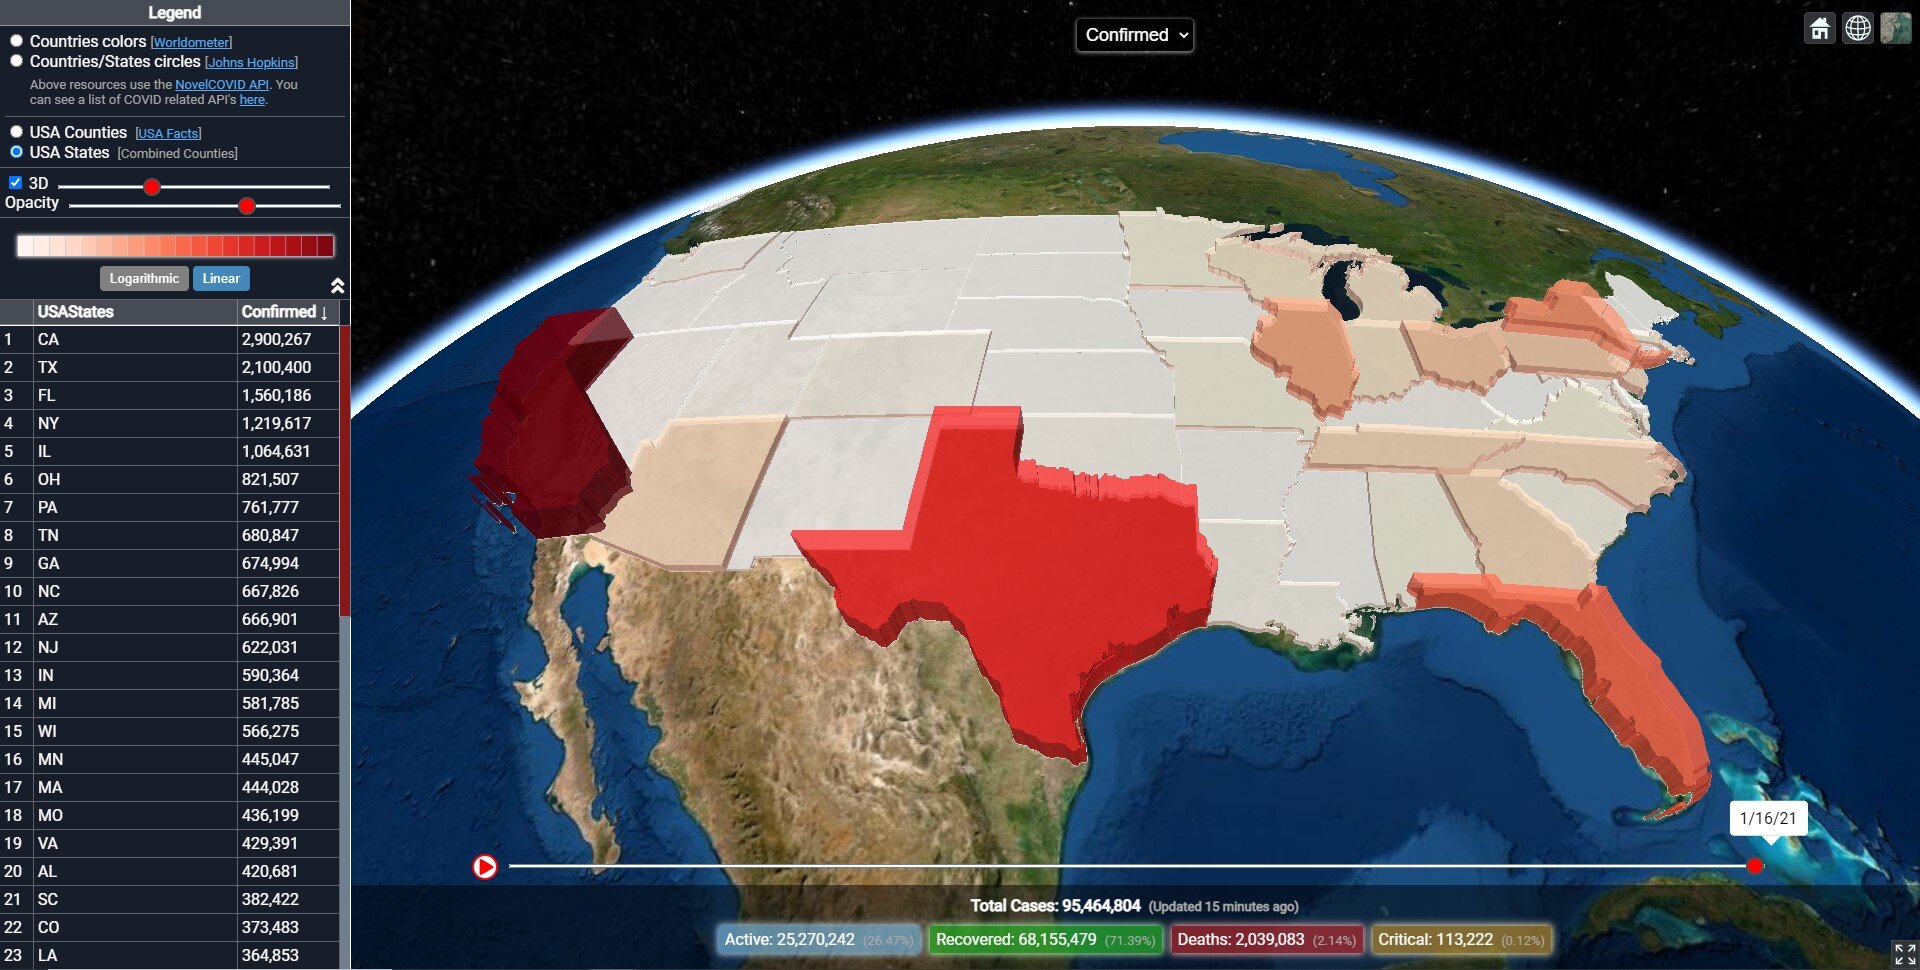
pandemic 3d - a covid19 visualizer
At the start of the Coronavirus pandemic many data visualizers started popping up. At the time I had just gotten good at programming in a 3D framework called Cesium.js and I thought a 3D Covid visualizer would be the perfect project to help understand the data. Seeing the depth of the numbers (quite literally) helps to bring a new perspective and can hopefully be a useful tool for scientists and medical and logistical professionals trying to solve this global issue.